Examples
Very Simple |
Examples of using NetMaker and neural network applications.
MLP vs Cascade-Correlation
Download example (150kB) - project and data files.
Short introduction:
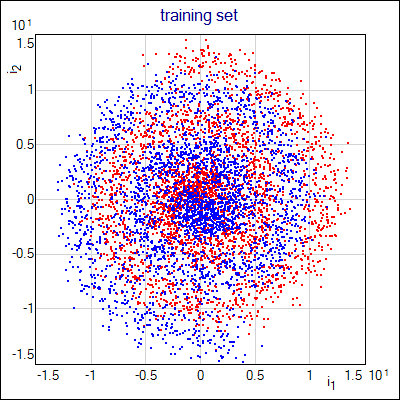
This is a popular two-spiral test in modified version. Two network models with dynamic structure are compared: Cascade-Correlation and dynamic MLP network. Like in the previous examples, this is the separation of two classes, but this time the problem is much more complicated. Events from the Red and Blue classes are twisted in two interlocking spirals (used training set is shown in the image below). Spirals are fuzzy and not clearly separable.
What is in the project:
Project contains three pairs of data-network blocks. Each data block is filled with the same training set of events (shown above). Networks are: MLP network with static structure, MLP network with dynamic structure and Cascade-Correlation network. Networks are ready to run the training, coefficients are randomized each time the project file is open. Training algorithm is set to quick-prop, parameters are set to reasonable values (not identical, but adjusted for stable and efficient training). Zip archive contains also files which were used to obtain images presented below (trained network coefficients; testing set of two-spiral test events; set of events that uniformly cover 2D space of the network input). There is also a training set used in the original, simple form of the two-spiral test (
plain_spiral.prn).
How to run this example:
Open Go dialog window of the Network block corresponding to the model you'd like to train; push there Go! button and wait for results. Save iteration info is turned on and you may observe the training error (select menu Edit - Add Graph - Network Error, right click in the plot window to open the context menu, select Add Net Source to open dialog window, select the network that is currently running and push OK). Multiple network may be trained at the same time (and the training progress may be plotted on the single image). Auto Stop is turned on for dynamic models - when the network is considered ready, training stops; static MLP network have fixed number of training iterations - it is required due to the slow error decrease observed in this example.
Following image shows the training progress of the networks:
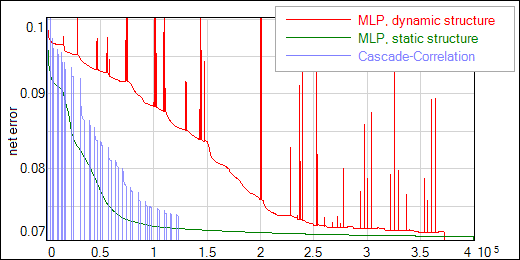
Training process of Cascade-Correlation network consists of two alternating steps - output layer training and new neuron candidates training (seen on the image as gaps in the blue plot). Usually dynamic MLP network reaches lower error values, but needs more training iterations than Cascade-Correlation network (also iteration time of MLP is much longer than for Cascade-Correlation). The disadvantage of Cascade-Correlation network is that it doesn't work well if training set is "fuzzy". Further training of Cascade-Correlation network may lead to lower error value, but network loses its generalization capabilities. The default training sets may be replaced with events from the
plain_spiral.prnfile, where mentioned problem doesn't appear - then training of both models should lead to the comparable (and very small) error values.
If the hidden layer sizes, necessary to solve the fuzzy two-spiral problem, are known at least approximately, it is possible to prepare the network with the static structure of the comparable size. You may try to start the training several times with different number of the hidden neurons.
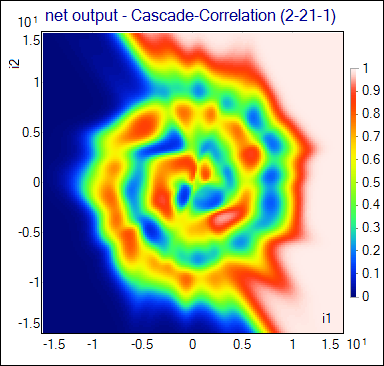
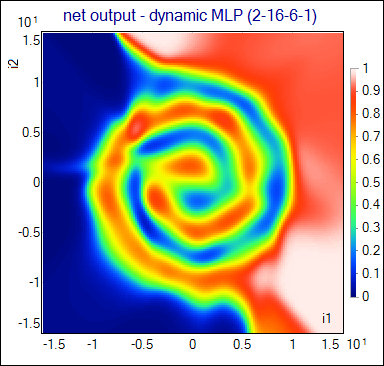
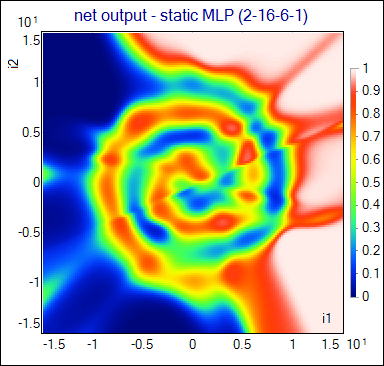
The network output is shown in the following images as the function of 2-dimensional network input. The same images may be obtained with 2D test data block - you need to connect input of the network block to 2D test data block and run the network with JustRun method; then create XY Data Points graph and choose color palette instead of ConstColor (use the default Z Axis Data variable,o1).
Network performance may be compared on the purity-efficiency plot. Results of both dynamic models are presented on such plot below, together with the curve obtained for the MLP network trained with the static structure (file
net_static_16-6.NetAscii). Testing set of events (not shown to the network during the training) was used to calculate purities and efficiencies.
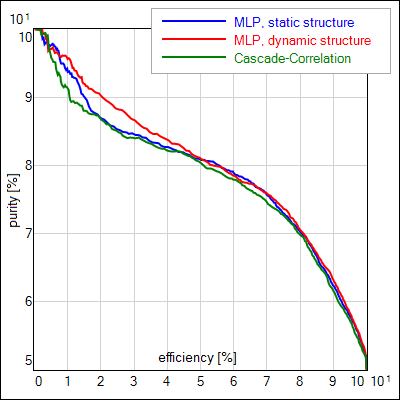
Training parameters of each network model in this example have been adjusted to obtain the highest purity-efficiency curves for testing set of events. In particular, regularization (WeightDecay parameter) has great impact on the quality of results. This parameter significantly improves the results of Cascade-Correlation network, even though value used in this example is very small (2⋅10-5).